Multipath
Fading
![]() Refractivity in the atmosphere (II)
Refractivity in the atmosphere (II)
![]() Observed impairments in the Rx signal
Observed impairments in the Rx signal
© 2001-2014, Luigi Moreno, Torino, Italy
_______________________________________________________________
Summary
In this Session
multipath propagation is considered. First, refractivity conditions are
discussed and the received signal impairments are presented (signal attenuation
and distortion). Multipath activity
statistics are described, according to the Rayleigh model, and the multipath
occurrence factor is defined. These models are applied for outage prediction,
for both narrow-band and wide-band systems. Finally, multipath countermeasures,
space and frequency diversity, are considered.
Refractivity
in the atmosphere (II)
A general
introduction to the effect of the atmosphere refractive index on radio
propagation and specifically of a vertical refractivity gradient has been given
in a previous
Session.
In that context,
we mainly considered constant gradient conditions, and we defined the
"standard atmosphere" as the condition with vertical refractivity
gradient G = - 40 N/km (k-factor =
1.33). Still under the assumption of a
constant refractivity gradient, other conditions are the "sub-refractive
atmosphere" (G.>.-.40 N/km; k.<.1.33) and
the "super-refractive atmosphere" (G.<.-.40 N/km; k.>.1.33).
A constant
vertical refractivity gradient means that the ray trajectory suffers the same curvature, at any
elevation in the atmosphere. Under this
condition, a direct ray trajectory is identified, from the Tx antenna to the Rx
antenna, with launching angle a given by:
where
![]()
RE is
the equivalent earth radius (8500 km with standard k-factor = 1.33), HT
and HR are the antenna heights at the transmitter and receiver,
respectively, and D is the path length.
Ray trajectories in "constant gradient" atmosphere
More generally, the vertical refractivity
gradient may deviate from a constant-gradient model. It may be assumed as constant within
atmospheric layers of limited
height (stratified atmosphere). In the real case, the
transition from one layer to another is smoothed in some measure.
A stratified atmosphere
model is useful in explaining the different
bending of ray trajectories, when they travel at different elevations in the
atmosphere.
In
these conditions, the "gradient profile" may be such that not only a direct ray, but multiple rays,
with different launching angles, reach the receiver antenna through several
spatially disjointed paths. This is called "multipath propagation".
Ray trajectories under multipath propagation conditions
As
a result, the received signal is made by several components (signal echoes),
adding together with random amplitude, delay, and relative phase shift.
Observed
impairments in Rx signal
Signal
attenuation
Using
a vectorial representation of signals, the received signal, under multipath
propagation, can be viewed as the addition of multiple vectors.
The component
vectors may interfere each other, at a given time instant, in a constructive or
destructive way, depending on the relative phase shifts.
Addition of multiple signal echoes, represented by vectors,
at two subsequent time instant
The
relative phase of component vectors depend on the difference in the path length
traveled by each signal component. Note
that the wavelength is of the order of centimeters and even small movements in atmospheric layers may significantly modify the
path distances and the relative vector phases.
So,
at different time instants, variations in the component vector phases may
produce sudden variations in the resultant vector amplitude; the received signal power may be almost cancelled, for short periods
(fraction of a second, or few seconds).
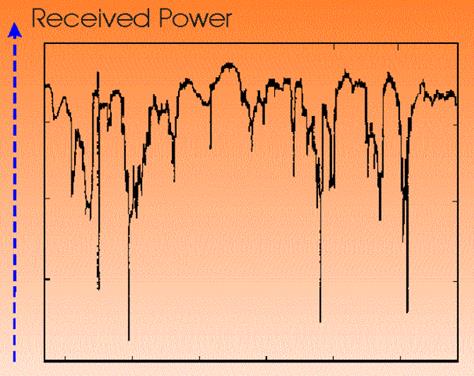
An example of received signal power vs. time,
during a multipath propagation event
The above figure
can be compared with graphical
definition of received signal thresholds and margins, as given in a
previous Session.
Clearly, during
multipath events, the received signal power may fade below the hop threshold,
so that a system outage is observed.
This will be discussed in a subsequent
section.
Signal
distortion
The
phase shift d
between two vector components is computed as a function of DL (length difference in the
paths traveled by the two rays) and of the signal wavelength l :
![]()
The
above formula shows that the relative phase of component vectors depend on the
signal frequency (or wavelength). The pictures above can be thought as valid for a
given frequency, but slightly different phase patterns are applicable to
adjacent frequencies.
This
means that multipath fading is "frequency selective".
While
a deep fading condition is observed at a given frequency F1, the signal at a
different frequency F2 (some MHz apart) is probably received with lower
attenuation.
Because of the
fast variability of multipath events, this condition could be reversed in a
very short time (a deep fading at frequency F2 and a higher Rx power at
frequency F1).
We recall that,
for undistorted transmission, the transmission channel must have a
"flat" amplitude response in the whole signal bandwidth. A similar
requirement applies to group-delay response.
During multipath
events, it has been observed that the transmission channel cannot be considered
as a "flat response" channel if the monitored bandwidth exceeds some
10 -12 MHz.
Therefore,
"narrowband" signals (approximately below 10 MHz bandwidth) do not
suffer the frequency selective effect of multipath propagation.
On the other hand,
distortion caused by frequency selectivity represents a further impairment (in
addition to signal attenuation) for "wideband" signals (approximately
above 15 MHz bandwidth).
Amplitude and
Group-Delay distortions produce Intersymbol Interference on digital signals,
thus worsening the receiver performance for a given signal-to-noise ratio (Rx
power).
![]()
Degradation
of Cross-pol discrimination
An additional impairment due to multipath fading is a
degradation of the receiver cross-polar discrimination. Such discrimination is required when multiple
RF channels are transmitted in a radio hop and both polarization are used (co-channel or interleaved channel
arrangements).
Under non-fading conditions, the hop performance are
determined by the antenna
cross-polar discrimination (XPD), both at the transmitter and at the
receiver.
During multipath events, as far as the signal
attenuation is moderate, the cross-polar signal is usually well correlated to
the co-polar one and the XPD performance is maintained.
On the other hand, when signal attenuation becomes
deeper, the XPD appears to be degraded, mainly because of the antenna response
to multipath components.
The mechanism can be clarified by considering the co-pol
and cross-pol antenna patterns. While the co-pol pattern usually shows a rather
flat maximum in the pointing direction, the cross-pol pattern has a very narrow
minimum in the same direction.
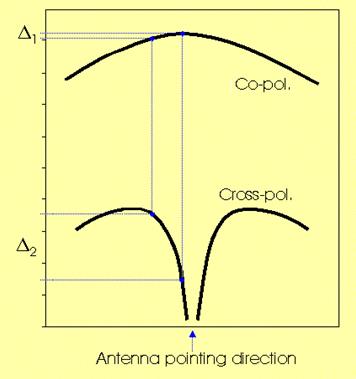
Antenna response to two rays, with slightly
different arrival angles:
the two co-pol components are almost equal, while
the difference between the cross-pol components is
large (D2).
The two co-pol components may almost cancel (if with
opposite phase), while the dominant cross-pol component is large in any case.
So a significant degradation may affect the overall XPD.
A second mechanism may be involved in the XPD
degradation during multipath events, when some multipath components are
produced by reflection or terrain scattering.
In that case, the signal polarization of the reflected or scattered
signal is rotated (in some measure) and the cross-pol signal is increased.
Performance prediction models usually assume that, as
far as the signal attenuation is within some 10-15 dB, the XPD is determined by
the antenna measured performance. On the
other hand, for deeper fadings, some XPD degradation is expected (up to 1 dB
additional degradation for 1 dB additional signal attenuation).
Modeling multipath activity
Multipath events
are observed with daily and seasonal cycles, when suitable refractive gradient
profiles are more often observed. A
multipath activity period can last tens of
minutes, or even one or several hours.
A prediction model
of multipath activity is implemented by correlating significant radio link and
environmental parameters with statistical observation of multipath events.
Radio and
environmental parameters
Radio link parameters which have been recognized as affecting multipath
events are :
· Working frequency;
· Path length;
· Path inclination.
Environmental
conditions which are likely to produce multipath events are :
· flat terrain;
· strong evaporation (high temperature and humidity);
· absence of wind.
It is often useful
to identify climatic regions with specific characteristics, so that multipath
activity can, in some measure, be correlated with regional parameters.
Particularly in tropical climates, long multipath events can be observed.
Statistical
observation of multipath events
By monitoring a
radio hop during multipath events, a number of recordings, similar to the above figure, can be collected. This enables to build up statistical data
about the time periods with fade depth below given thresholds.
A large amount of similar experiments have shown that fade depth
statistics are well approximated by a Rayleigh distribution (at least for fade
depth greater than about 15.dB). According to that distribution, the
probability that the signal fade depth A (in dB) is deeper than a given value A0
is given by :
![]()
where P0
is called "multipath occurrence factor". (To be more precise, this is the Rayleigh
"asymptotic" trend, derived for low probability and deep fade
levels).
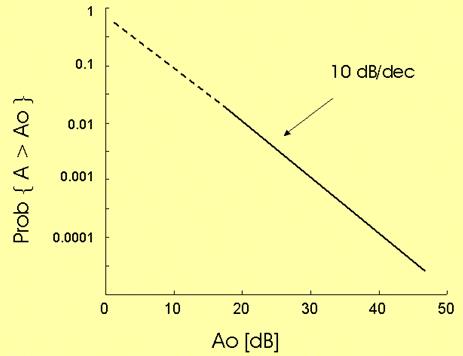
An example of Rayleigh cumulative distribution, with P0 = 1
Note that, if the
reference fade depth A0 increases 10 dB, then the corresponding
probability is lower by a factor 10 (the diagram slope is 10 dB / decade).
This experimental result
is in good agreement with mathematical analysis, applied to the random vector
model, previously mentioned. It can be
shown that, if we add a large number of vectors, with random amplitudes and
phases, then the resultant vector amplitude is a random variable with Rayleigh
distribution.
The Rayleigh model
for multipath fade depth is described by a single parameter P0.
We can imagine to
collect fade depth statistics on a given radio hop in different time periods,
or on radio hops with different length, working frequency, and/or in different
climates. We expect that, in some
measure, the experimental results approximate the Rayleigh formula given above,
even if a different P0 value will apply in each case. So, the P0 parameter gives a
measure of the "multipath activity" on a given hop and within a given
time period.
The above example
suggests an experimental means to estimate the P0 factor when a
radio hop is already working. However,
the radio engineer needs prediction tools to estimate P0 while a
radio hop is at the design stage.
Several empirical
formulas have been proposed, giving P0 as a function of radio hop
parameters and of environmental conditions. The relevant factors are those
mentioned in a previous section.
Most of these
formulas have the following structure :
![]()
where C (geoclimatic coefficient), Q (terrain profile coefficient), a (frequency exponent), and b (path length exponent) are empirical
parameters. They are usually estimated
by processing large amounts of experimental data, or can derive from more
complex formulas, again related to the results of field measurements.
Generally, P0
is proportional to frequency (the a
exponent is equal, or close, to 1),
while the b exponent is in the range is 3.-.3.6 (the multipath occurrence increases about
ten times when the hop length is doubled).
Probably, the most popular model for P0 prediction is the
Bell Labs formula (reported in papers by W.T. Barnett and A. Vigants, in the early 70's). The general
formula mentioned above is applied (frequency in GHz, distance in km), with
the following parameters:
· a =
1;
· b =
3;
· C = 1 × 10⁻⁵ for dry mountainous regions;
· C = 2.1 × 10⁻⁵ for continental temperate regions;
· C = 3.1 × 10⁻⁵ for maritime temperate regions;
· C = 4.1 × 10⁻⁵ for maritime sub-tropical, high humidity and
temperature regions;
· Q = 1 / s 1.3
· s = profile
roughness, measured in meters as the standard deviation of terrain elevations
at 1 km intervals (in any case, s must be in
the range 6 m to 42 m).
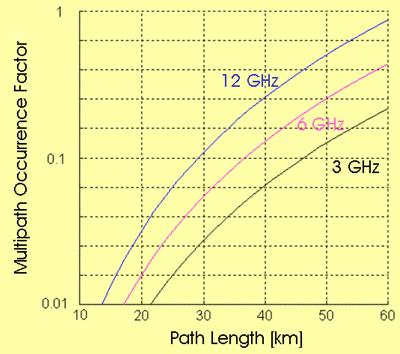
Examples of the
Barnett-Vigants model are given below.
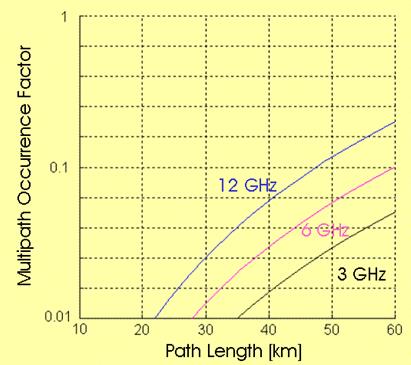
Application of the Barnett-Vigants model:
High dry mountainous regions; high roughness terrain (s = 42 m)
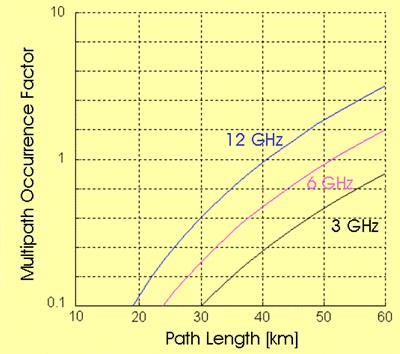
Application of the Barnett-Vigants model:
Temperate continental regions; average rolling terrain (s = 24 m)
Application of the Barnett-Vigants model:
Temperate maritime regions; low roughness terrain (s = 12 m)
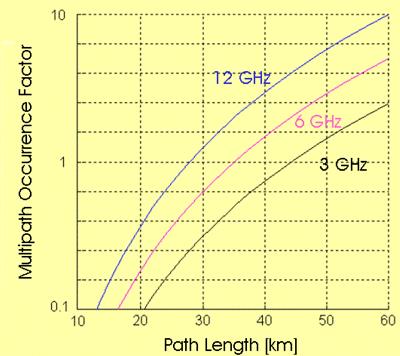
Application of the Barnett-Vigants model:
Sub-tropical, high humidity regions; flat terrain (s = 6 m)
An alternative model
is proposed by ITU-R Rec. P.530-15. The model structure is slightly different
and more complex with respect to the general
formula mentioned above. This model has been frequently revised in recent
ITU-R meetings and probably it is not yet at a final version.
![]()
ITU-R
Multipath occurrence model
ITU-R Rec. P.530-15 (released September 2013) gives a
model for the prediction of the Multipath Occurrence Factor P0.
The model provides two different formulas, to be
applied for detailed link design or for preliminary planning,
respectively. The main difference in the
two approaches is that the detailed design makes use of data on terrain
roughness around the radio path.
(Note : Rec.
P.530 gives the Rayleigh formula in %; a
0.01 factor is added in the P0. expressions given below to
take account of this).
Detailed link design :
![]()
where : K (=
geoclimatic factor) is given by :
![]()
ep = path inclination in
milliradians;
hL =
elevation of the lower antenna in meters;
dN1 =
refractivity gradient in the lowest 65 m of the atmosphere, not exceeded for 1%
of an average year;
sa
= area roughness around the radio path.
The refractivity gradient dN1 is provided on a
1.5° grid in latitude and longitude in ITU-R Rec. P.453.
The area roughness is defined as the
standard deviation of terrain heights (m) within a 110 km x 110 km area with a
30 s resolution.
Preliminary planning :
![]()
where : K (=
geoclimatic factor) is given by :
![]()
and the other symbols are already defined above.
Comment
The ITU-R model derives from the processing of a
significant amount of P0. estimates, at several
frequencies (up to 37 GHz) and with various path lengths in different climatic
environments.
The mathematical approach is mainly based on
minimizing the standard deviation between empirical data and prediction
formulas by means of multiple regressions.
The positive aspect is that the model is well related to observations in
real links. It is stated that the overall standard deviations of error using the proposed
models is of the order of 5 dB (including the contribution from year-to-year
variability).
On the other
hand, a physical model underlying formula structure and parameter choice is not
clearly defined, so that it appears that the proposed approach could be revised
on the basis of a new experimental
database, as already happened in recent years.
Performance
prediction
In a previous Session,
general concepts about fade margin and outage prediction have been briefly
discussed. In particular, it was found
convenient to distinguish between two outage conditions :
· when the outage is only caused by insufficient Rx power (received signal level below the hop threshold);
· when distortion in the Rx signal is expected to contribute to the outage, even when the Rx power is still above the hop threshold.
In the context of multipath propagation, the first condition applies to "narrowband" signals, since it is assumed that they do not suffer any distortion during multipath events. On the other hand, the second condition applies to "wideband" signals, which may be severely distorted by frequency selective multipath.
Outage prediction in
Narrowband systems
Outage events are observed when the Rx power is below the hop threshold.
Taking account of the multipath fading Rayleigh distribution, the outage probability POUT, can be predicted as :
where A is the signal attenuation caused by multipath propagation, FM is the hop Fade Margin, and P0 is the multipath occurrence factor.
The outage time TOUT during a given observation time T0 (typically, one month), is finally given as TOUT = T0 POUT.
In conclusion, two parameters are required for outage time prediction :
· the hop Fade Margin, given by the Link Budget computation;
· the multipath occurrence factor P0, given by some model for multipath activity, as the Barnett-Vigants one, presented above.
In this context,
the Fade Margin is often referred as the Flat Fade Margin, since it is used to
compensate for non-selective (flat) attenuation.
![]()
Outage prediction in Wideband systems
The prediction of Outage Time in Wideband systems
takes account that outage events may be caused by the combined effect of signal
attenuation and distortion. As a result,
the outage condition may be observed even if the Rx power is still above the
receiver power threshold.
Reference will be made to the prediction model
reported in ITU-R Rec. P.530-15. Using a
simplified approach, the model deals separately with the two impairments
(signal attenuation and distortion), so that the general formula for outage probability prediction is :
![]()
where PNS is the outage probability due to
signal attenuation (non-selective outage component), which is given by the same
outage formula derived for
narrowband systems, while PS is the outage probability due to
signal distortion (selective outage).
The selective component PS depends on the
receiver sensitivity to signal distortion. The Signature Measurement
is the tool used to characterize a radio equipment under this aspect. PS is given by :
![]() is the Multipath
Activity (directly related to the Multipath Occurrence Factor P0);
is the Multipath
Activity (directly related to the Multipath Occurrence Factor P0);
![]() is the mean time delay
[ns] of multipath echo components, which is a function of the hop length D (in
km);
is the mean time delay
[ns] of multipath echo components, which is a function of the hop length D (in
km);
W is the
signature width [GHz]; subscript "M" indicates that the signature was
measured with a Minimum
-Phase channel, while subscript "NM" refers to a
Non-Minimum-Phase channel.
B is the
signature depth [dB];
tr is the echo delay in the
signature measurement.
![]()
Outage contribution from X-pol interference
Since multipath events have an impact in reducing discrimination between
cross-polarized signals, multipath outage is increased by the effect of
cross-polar interference.
The Rec. P.530-15 prediction model assumes that
cross-polar interference contributes to the outage probability with an additive
term PXP.
![]()
where :
(C/I)0
is the threshold
Carrier-to-Interference ratio;
XPD is the
minimum cross-pol discrimination of the Tx and Rx antennas;
![]() is an empirical
parameter, where P0 is the multipath occurrence factor and h is the multipath activity, previously
defined.
is an empirical
parameter, where P0 is the multipath occurrence factor and h is the multipath activity, previously
defined.
Notes :
1) If XPD >
35 dB, then put XPD = 35 dB in the PXP
formula;
2) If a Cross-Pol Interference Canceller (XPIC) is used, then the threshold
C/I must be reduced by an amount equal to the XPIC gain;
3) if two separate antennas are used to transmit the
cross-polarized signals, then the Q definition is revised, by replacing the 0.7
factor with the K factor below :

(s = vertical
antenna spacing, l = signal wavelength).
Countermeasures
Several techniques
have been devised to reduce the impairments caused by multipath propagation.
Space
Diversity
As
with reflection
paths, two Rx antennas, with a suitable vertical spacing, receive the
multipath component signals with different phase patterns.
So, in a well arranged space diversity configuration, the Rx signals at the two antennas will exhibit a low correlation and the probability of deep fading at the same time can be significantly lowered. Typical spacing is of the order of 150 - 200 wavelengths.
A diversity improvement factor ISD is
defined as :
where
A1 and A2 are the attenuations at the two diversity
receivers, A0 is a reference attenuation and Prob{X , Y} means probability that events X and Y are true
at the same instant (joint probability).
The Barnett-Vigants
model is extended to space diversity reception, giving :
where
F is the working frequency in GHz, D the path length in km, S the vertical
spacing in m, and V is the difference of the two antenna gains in dB. Note
that the improvement factor is a function of the reference attenuation A0, so at different fade levels a different improvement
is predicted.
The Outage Time prediction,
for a Narrowband system, is derived from the Single Rx prediction and the definition of diversity improvement :
![]()
ITU-R model for Space Diversity improvement
An alternative formula to predict the space diversity
improvement is given by ITU-R Rec. P.530-15:
The Improvement factor is a function of the reference attenuation A0. F is the working frequency
in GHz, D the path length in km, S the vertical spacing in m, P0 is the Multipath Occurrence Factor and V is the difference of
the two antenna gains in dB (if any).
(Note :
coefficients have been revised in comparison with ITU-R formula because
Rec. P.530 gives the Multipath Occurrence factor in %).
1+1
Frequency Diversity
Again, we refer to
general concepts on
diversity techniques.
In this case, we
exploit the frequency selective
nature of multipath fading, so that two RF channels with suitable frequency
spacing exhibit the low correlation
property, which guarantees a low probability of deep fading in the two channels
at the same time.
Since a protection
channel is often required in multi-channel radio-relay systems in case of
equipment failure, it can be convenient that the same protection channel be
used also as a frequency diversity countermeasure to multipath fading.
For effective
multipath protection, fast quality detector and switching circuits are
required.
In
a 1+1 configuration, one working channel is continuously protected by one spare
channel. Similarly to Space
diversity, a Frequency Diversity Improvement Factor IFD can be
defined. According to the Barnett-Vigants
model, also applied in ITU-R Rec. P.530, it can be estimated as :
where F is the average working
frequency and DF
is the channel spacing (both in GHz), D is the path length in km. Also in this
case, the improvement factor is a
function of the reference attenuation A0 (in dB).
![]()
N + 1
Frequency Diversity
The frequency diversity arrangement can be extended from the 1+1
configuration, as assumed above, to N+1 configurations, where one RF channel is
used as a protection for N working channels
In N+1 systems it is expected that the frequency
diversity effectiveness is reduced in some measure.
If, in the unprotected condition, M channels are in
the outage state, then using frequency protection the number of outage channels
is reduced to M-1. A fairly complex
probability and combinatorial problem must be solved to estimate the outage
time reduction given by N+1 frequency diversity.
With good approximation, a simplified solution is
obtained by defining an "equivalent channel spacing". By this approach, the Frequency Diversity
improvement in N+1 systems with channel spacing DF is equal to the improvement in an
"equivalent" 1+1 diversity system with channel spacing DFEQ given by:
So, we can use again the previous (1+1)
improvement formula, with DFEQ
instead of DF.
![]()
Outage in Wideband systems with Diversity
In rather general terms, it can be stated that the
outage probability in a diversity system (POUT, DIV) is related to
the outage probability with single reception (POUT, SINGLE) through
the formula :
where h is the (previously defined) multipath activity (that is the
fraction of time with multipath events) and k is the correlation factor between
the two diversity signals.
In the case of the non-selective outage probability,
the Diversity Improvement IDIV
= (POUT,SINGLE / POUT,DIV ) is given by empirical
formulas, for both Space and Frequency Diversity. Then,
the above formula can be reversed to derive the non-selective
correlation factor kNS:


On the other hand, the selective correlation factor kS
is given by Rec. P.530-15 as a function of kNS (complete formulas
are not added here).
Once the (non-selective and selective) correlation
factors are known, the outage probabilities can be computed using the general formula reported above, for both
the non-selective outage component (PNS,DIV) and the selective one
(PS,DIV).
Finally, the two outage
components are combined to give the overall outage probability:
![]()
Note : The
outage prediction model reported by ITU-R Rec. P.530-15 gives different
formulas to combine the non-selective and selective outage components in the single and diversity conditions.
![]()
Adaptive
equalizers
Adaptive equalization is part of the demodulation
process. The equalizer is implemented as
a self-adjusting circuit (at the IF or baseband stage), which is able to
partially compensate for multipath distortion in wideband digital systems.
The objective is to reduce the selective outage component, so that
(with an ideal equalizer) outage should be observed only when the received
power fades below the Rx threshold.
The IF equalizer is usually described in the frequency
domain, as a circuit whose transfer function is complementary to the multipath
channel transfer function. The overall transfer function (transmission channel
plus equalizer) should approximate an ideal non-distorting channel.
The BB equalizer is usually described in the time
domain, as a transversal filter (or decision feedback filter), which cancels
undesired tails in the transmission channel impulse response, so reducing
intersymbol interference. In some radio
equipment, the BB equalizer and the Cross-pol Interference Canceller (XPIC) are implemented in
a single circuit.
The receiver signature gives a measure of the effectiveness of
an adaptive equalizer. By comparing the
signature with and without equalizer, the improvement (outage reduction) given
by the equalizer can be estimated (see the selective outage prediction formula, based on signature
parameters).
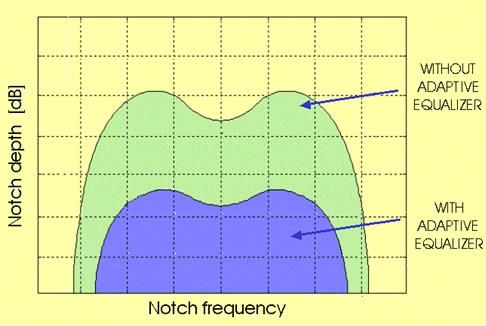
Equipment signatures without and with an adaptive
equalizer.
Further
Readings
Rummler W.D. et al., "Multipath fading channel models for microwave digital radio", IEEE Comm. Magazine, vol. 24, n. 11, November 1986, pp. 30-42.
Greenstein M.J. and Shafi M., "Outage calculation methods for microwave digital radio", IEEE Comm. Magazine, vol. 25, n. 2, February 1987, pp. 30-39.
Martin A.L., "Dispersion signatures; some results of laboratory and field measurements", European Conf. on Radio Relay, Munich, 1986.
Greenstein L.J. and Yeh Y.S., "A simulation study of space diversity and adaptive equalization in microwave digital radio", AT&T Bell Lab Tech. J., vol. 64, n. 4, April 1985, pp. 907-935.
Sebald G. et al., "Advanced time- and frequency-domain adaptive equalization in multilevel QAM digital radio systems", IEEE Journal on Selected Areas in Communications, vol. JSAC-5, n. 3, April 1987.
Giger A.J. and Barnett W.T., "Effects of Multipath Propagation on Digital radio", IEEE Trans. on Communications, vol. 29, n. 9, Sept. 1981, pp. 1345-52.
Barnett W.T., "Multipath propagation at 4, 6 and 11 GHz", BSTJ, vol. 51, n. 2, February 1972, pp.321-361.
Vigants A., "Space diversity engineering", BSTJ, vol. 54, n. 1, January 1975, pp.103-142.
Vigants A. and Pursley M.V., "Transmission unavailability of frequency-diversity protected microwave systems caused by multipath fading", BSTJ, vol. 58, n. 8, October 1979, pp.1779-96.
End of Session #5
_______________________________________________________________
© 2001-2014, Luigi Moreno, Torino, Italy