Rain
Attenuation
![]() EM wave interaction with atmosphere
EM wave interaction with atmosphere
![]() Worldwide rain intensity statistics
Worldwide rain intensity statistics
![]() Rain unavailability
prediction
Rain unavailability
prediction
© 2001-2014, Luigi Moreno, Torino, Italy
_______________________________________________________________
Summary
In this Session we
first discuss the interaction of an EM wave with molecules encountered throughout the propagation path in the
atmosphere. This leads to an estimate of rain specific attenuation, as a
function of rain intensity, signal frequency and polarization. Statistical data
on rain intensity are considered, as required by the ITU-R rain attenuation
model, which is presented as the basic tool to predict rain unavailability in
any region in the world, at frequencies up to about 40 GHz.
EM
wave interaction with atmosphere
Even if this
Session is mainly devoted to rain effects, we first consider, in more general
terms, the interaction of EM waves with molecules and particles encountered
throughout the propagation path in the atmosphere.
Two effects are
most significant :
· absorption: EM energy transferred to the impacted molecules and
converted into heat;
· scattering: EM energy re-irradiated away from the propagation direction
it had before impact.
Both effects are
mainly affected by :
· Molecule / particle dimensions, relative to the wavelength of the EM
radiation;
· Electrical properties of the involved molecules.
We consider the
effect of the atmosphere in the absence of rain and the attenuation due to
raincells.
Phenomena related
to other hydrometeors (snow, ice, fog, hail) and even to dust storms will not
be discussed here (ITU-R Rec. P-840 gives some indication about the effect of
thick clouds and fog).
Water vapour
and Oxygen attenuation in clear air
In the frequency
range up to about 40 GHz, the atmospheric molecules which interacts with EM
waves are water (in the form of water vapour) and, more marginally, oxygen.
A water vapour
absorption peak is observed at 22.2 GHz, while the first oxygen absorption peak
is at about 60 GHz. Other absorption
peaks, for both water vapour and oxygen, are at higher frequencies.
The maximum attenuation due to water vapour (gWV), at 22.2 GHz, is given by (according to ITU-R Rec. P-676) :
![]()
where r is the vapour density in g/m3,
the atmospheric pressure is 1013 hPa and the temperature is 15°C.
This gives a 0.30
dB/km attenuation at the water vapour saturation level (about 12 g/m3
at 15 °C) and 0.18 dB/km at a lower vapour density of 7.5 g/m3.
On the other hand,
the specific attenuation due to oxygen exceeds 1 dB/km in the frequency range
52 to 68 GHz; the maximum attenuation, at 60 GHz, is about 16 dB/km, while at
40 GHz it is below 0.1 dB/km.
For radio hops up
to about 40 GHz, the conclusion is that the power loss caused by atmospheric
absorption is usually not significant.
In most cases it can be neglected in the Link Budget, also considering
that the hop length is anyway limited by rain attenuation.
An EM wave,
traveling in a given direction through a raincell, loses part of its power in
that direction, as a result of absorption and scattering effects.
In the impact with
a raindrop, the total power lost depends on the "drop cross section",
which is given by the sum of a scattering cross section and an absorption cross
section.
The drop cross
section is a function of the drop radius and of the signal wavelength.
By integrating the
power lost in the impact with a single raindrop to all the raindrops in a given
volume (raincell), the total loss produced within that raincell can be
estimated.
To do this,
suitable statistical models are needed to relate the number of raindrops in a
raincell and their size distribution to the rain intensity. Such models have been tuned on the basis of a
large amount of experimental data, coming from different regions in the world.
As a result, the specific rain attenuation g (dB/km) can be expressed, as a function of
the rain rate R (in mm/h), by the following exponential formula:
![]()
where the
parameters k and a are functions of the signal
wavelength and polarization.
ITU-R Rec. P-838
gives a table with the k and a values,
for Vertical and Horizontal polarizations, in the frequency range 1 to 400
GHz. Formulas are given for the case of
any linear or circular polarization.
Examples of
specific rain attenuation as a function of rain rate, are given in the figure
below; note that the increase in
specific attenuation is about 100 times, when passing from 3 to 12 GHz. Moreover, the Vertical polarization is
significantly less attenuated than Horizontal polarization, at the same
frequency.
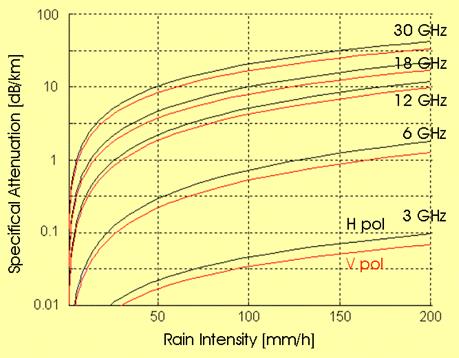
Attenuation vs. rain intensity, for different signal frequencies,
vertical (red) and horizontal
(black) polarizations
![]()
Other rain
impairments
EM wave depolarization - An
additional effect must be considered when a linearly polarized EM wave travels
through a raincell: a rotation of the polarization plane, so that an
orthogonally polarized component can be observed at the output of the cell.
The de-polarization effect is related to the raindrop
shape and to the dropping angle (in most cases, not perfectly vertical).
It is possible to establish a statistical relation
between rain attenuation and depolarization effect. For a given probability P,
we define the "equi-probable" levels in co-polar attenuation (CPAP)
and cross-polar discrimination (XPDP) as:
![]()
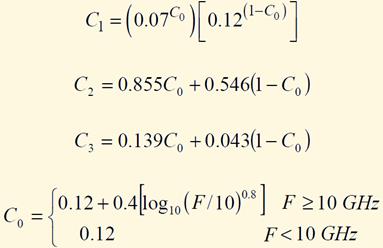
XPDP can be predicted from CPAP
(that is when the CPA cumulative distribution is known) as:
![]()
where : ![]()
![]()
![]()
Interference due to wave scattering - A
raincell may become a potential source of interference to other radio systems,
since part of the EM energy which impacts the cell is scattered in multiple
directions. The propagation model to be applied in such conditions is described
by ITU-R Rec. P.452-10.
It is rather unlikely that a P-P link may produce a
significant interference effect to another P-P link, through raincell
scattering. The TX power level is
usually at (or below) 1 W and the cell scattering works almost like an
omnidirectional radiator, so a low power density is associated with the
scattered signal.
On the other hand, high power radio transmitters, in
particular large earth stations for satellite communications, have the
potential for producing a not negligible interference through raincell
scattering. Detailed procedures are
recommended by ITU-R documents to take account of this, when the satellite
system operates in frequency bands shared with terrestrial systems.
Worldwide
rain intensity statistics
An important input
to any rain attenuation model is the expected rain activity in the region where
the radio hop will operate, as derived from long-term statistics.
More specifically,
it was found useful to refer to the low-probability tails of rain statistics,
since we are mainly interested in rare events with very heavy rainfall.
The rain rate exceeded for 0.01% of the time is the significant
parameter, useful to characterize the rainfall activity in a given region.
If possible, this rain rate should be derived from reliable
statistical data about the local rain events. When local data are not
available, the procedure recommended by ITU-R can be used.
In the last release of Rec. P-837 a new
approach is reported to estimate the rain rate exceeded for any percentage of
time, in any part of the world. This is based on data files (available from the
ITU website), derived from 15 years of data of the European Centre of
Medium-range Weather Forecast (ECMWF). They cover all the world, with latitude
and longitude grids in 1.5° steps. A
suitable interpolation procedure is recommended.
To give an
approximate information about the rain rates used in rain attenuation
predictions, the previous ITU-R approach is reported, which was based on world
maps with "rain regions".
Each region was labeled with a letter; in the table below, each letter
is associated with the corresponding rain rate (in mm/h) exceeded for 0.01% of
the time :
|
A |
8 |
D |
19 |
G |
30 |
K |
42 |
N |
95 |
||||
|
B |
12 |
E |
22 |
H |
32 |
L |
60 |
P |
145 |
||||
|
C |
15 |
F |
28 |
J |
35 |
M |
63 |
Q |
115 |
The world maps are
shown below.
ITU-R Rain regions, North America
(from ITU-R Rec. P-837-1 Fig.1, by ITU permission)
ITU-R Rain regions, Centre and South America
(from ITU-R Rec. P-837-1 Fig.1, by ITU permission)
ITU-R Rain regions, Europe, Africa and Middle East
(from ITU-R Rec. P-837-1 Fig.2, by ITU permission)
ITU-R Rain regions, Asia and Oceania
(from ITU-R Rec. P-837-1 Fig.3, by ITU permission)
ITU-R rain attenuation model
Rain intensity
model
In order to apply raincell models to the estimate
of rain attenuation in a radio hop, it is necessary to consider how the
raincell size compare to the hop length.
While in very
short hops (below some 2 - 3 km) the whole length may be affected by rainfall,
in longer hops a raincell occupies only a portion of the whole distance.
ITU-R Rec. P-530 defines an "effective hop length" DEFF,
in order to take account of raincell
size :
![]()
where :

And a is
theexponent of the Specific Attenuation model,
previously discussed.
Note that the
effective length is a function of the local rain rate R (in mm/h). As shown in the diagram below, the effective
length is more compressed with high rain rates (a raincell with high rain rate
is expected to occupy a smaller area).
On the other hand, the effective length is close to the real length as
far as the latter is approximately below 4 km.
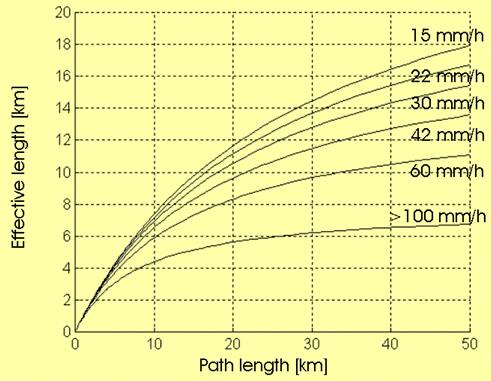
Conversion from real path length to effective length DEFF,
for various rain rate values
ITU-R Rec. P-530
gives a step-by-step procedure to estimate the time percentage that rain
attenuation exceeds a given threshold on a radio hop.
Input parameters
are the hop length, the signal frequency and polarization, and the operating
region. The recommended procedure is as
follows :
· Estimate of the local rain rate R for 0.01% of time. This should derive
from long-term statistical data collected in the specific zone; otherwise, ITU-R data can be used, as indicated in the previous
section.
· Application of the specific loss
(g) formula, given the rain rate R, the signal
frequency F and polarization (H or V).
· Reduction of the hop length to the Effective Length DEFF
(km), according to the above formula.
· Computation of Rain Attenuation exceeded for 0.01% of time :
![]()
· Extrapolation to other time percentages p, in the range from 1% to
0.001% :
![]()
where :
An example is given below, where A0.01 has been assumed to
be 30 dB. Note that the abscissa gives
the attenuation exceeded for the corresponding time percentage.
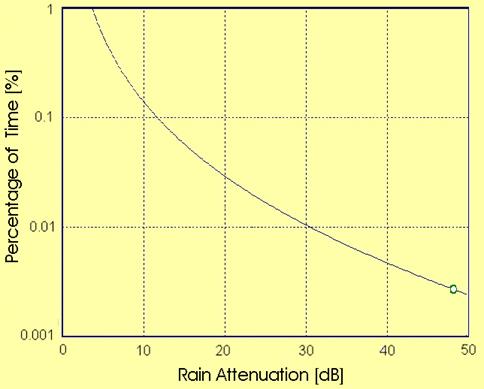
Percentage of time vs. Rain attenuation, assuming A0.01 = 30
dB
The ITU-R
prediction method is considered to be valid for frequencies up to 100 GHz and
hop lengths up to 60 km.
![]()
Frequency
/ polarization scaling model
An alternative model proposed by ITU-R (Rec. P.530)
can be applied when experimental results are available about rain attenuation
on the same hop, measured at a different frequency and/or polarization.
In that case, we need to scale the measured result to
the frequency and/or polarization used in the project of interest.
The following empirical formula can be used to
estimate rain attenuation A2 at frequency F2, for a given
time percentage, when long-term experimental statistics at frequency F1
predict attenuation A1 for the same time percentage (frequency in
GHz, attenuation in dB):
![]()
where ![]()

Similarly, when long-term experimental statistics on a
given polarization at frequency F predict attenuation A for a given time
percentage, then the attenuation on the orthogonal polarization, at the same
frequency and for the same time percentage can be estimated as :
Rain unavailability prediction
For a given radio hop,
the attenuation due to rain for 0.01% of the time can be estimated, according
to the ITU-R procedure, as a function of the local rain rate, of the hop
length, and of the signal frequency and polarization.
To predict the hop
unavailability caused by rain, it is necessary to reverse the formulas given above (Attenuation
vs. time percentage p), in order to get the time percentage as a function of
signal attenuation (note anyway the 0.001% to 1% application range). So, rain unavailability is predicted as the
probability that rain attenuation exceeds the Fade Margin FM.
The same result
can be graphically derived from the Time
% vs. Rain Attenuation curve.
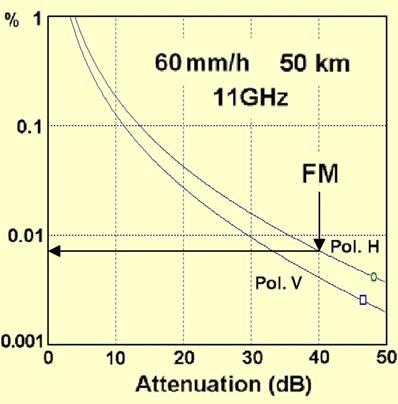
Rain unavailability prediction, given the hop Fade margin FM
The hop Fade
Margin is computed as a result of Link Budget. In
presence of heavy rainstorms, the thin water layer on the antenna radome (if
used) produces an additional loss; the Fade Margin is reduced to take account
of the "wet radome loss", a
conservative figure being about 1 dB.
Quite often the
rain unavailability prediction is transformed from a percentage probability to
"minutes in one year". As a
reference, the 0.01% probability is equivalent to about 50 min/year.
However, since the
prediction method is based on long-term rain intensity statistics, also the
estimated unavailability must be considered as an average, to be expected
during a period of several years.
![]()
Effect of
cross-polarized interference
Signal depolarization caused by rain contributes to
rain unavailability by reducing the discrimination to a cross-polar interfering
signal. Typically, the problem arises in
radio systems using a co-channel
frequency plan, with the same radio channel used on both polarizations.
The step-by-step procedure reported by ITU-R Rec.
P.530 is as follows :
![]() Computation of the "reference attenuation" AP :
Computation of the "reference attenuation" AP :
![]()
where U and V have been previously defined.
![]() Computation of the normalized parameter m (if m>40, then m=40):
Computation of the normalized parameter m (if m>40, then m=40):
![]()
where A0.01 is the attenuation exceeded for 0.01% of the time.
![]() Estimate of probability PXPR (unavailability due to
cross-polar interference):
Estimate of probability PXPR (unavailability due to
cross-polar interference):
![]()
Reliable estimates of PXPR are in the range
10-2 to 10-5.
Finally, the overall rain unavailability can be
estimated as the larger of PXPR (see above) and PRAIN (probability of unavailability due to rain
attenuation only).
Further
Readings
Crane R.K., "Prediction of attenuation by rain", IEEE Tr. Communications, vol. 28, n. 9, 1980, pp.1717-33.
Fedi F., "Prediction of attenuation due to rainfall on Terrestrial Links", Radio Sci., vol. 16, n.5, 1981, pp. 731-743.
Olsen R.L., "Cross polarization during precipitation on a terrestrial link. A review", Radio Sci., vol. 16, n. 5, 1981, pp. 761-779.
Holt A.R. et al., "Frequency scaling propagation parameters using dual-polarization radar results", Radio Sci., vol. 19, n. 2, 1984, pp. 222-230.
Segal B., "Spatial correlation of intense precipitation with reference to the design of terrestrial microwave networks", IEE Int. Conf. on Antennas and Propagation (ICAP), Norwich 1983.
End of Session #6
_______________________________________________________________
© 2001-2014, Luigi Moreno, Torino,
Italy